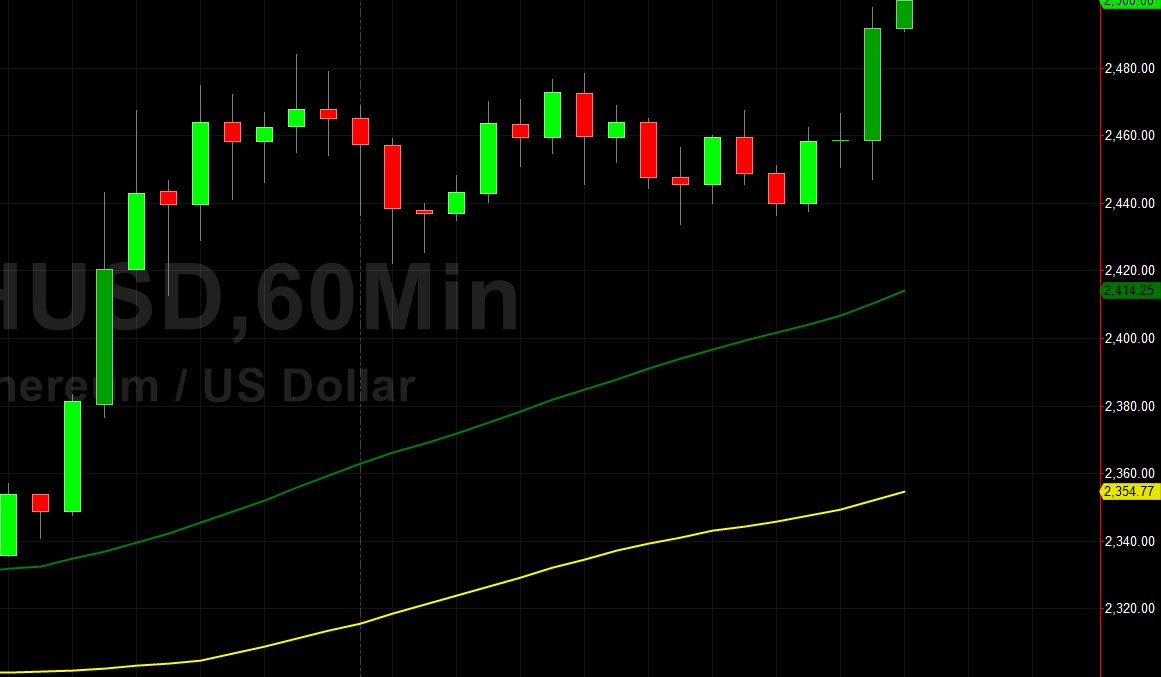
Ethereum (ETH/USD) benefitted from an improving risk profile early in the Asian session as traders sought to add to recent upside progress that saw the pair eclipse the psychologically-important 2500 figure for the first time in several weeks. Recent buying pressure around the 2422.31 level represented a test of the 38.2% retracement of the recent appreciating range from 2317.51 to 2484. ETH/USD scored gains of 7.3% in July and has notched gains of more than 232% year-to-date.
Above recent areas of technical significance, additional upside retracement levels include the 2631.60, 2657.89, 2725.47, 2742.76, 2913.68, 3042.22, and 3056.22 levels. Following the recent ascent to multi-week highs, downside price retracement levels include 2333.53, 2303.32, 2191.54, 2041.42, and 2000.49 areas. Traders are observing that the 50-bar MA (4-hourly) is bullishly indicating above the 100-bar MA (4-hourly) and above the 200-bar MA (4-hourly). Also, the 50-bar MA (hourly) is bullishly indicating above the 100-bar MA (hourly) and above the 200-bar MA (hourly).
Price activity is nearest the 50-bar MA (4-hourly) at 2268.66 and the 50-bar MA (Hourly) at 2394.04.
Technical Support is expected around 1700/ 1633.51/ 1456.03 with Stops expected below.
Technical Resistance is expected around 3122.22/ 3420.10/ 3788.66 with Stops expected above.
On 4-Hourly chart, SlowK is Bearishly below SlowD while MACD is Bullishly above MACDAverage.
On 60-minute chart, SlowK is Bearishly below SlowD while MACD is Bearishly below MACDAverage.
Disclaimer: This trading analysis is provided by a third party, and for informational purposes only. It does not reflect the views of Crypto Daily, nor is it intended to be used as legal, tax, investment, or financial advice.
* This article was originally published here

No comments:
Post a Comment